Lesson 4 of 17 · Reading charts
Reading candlestick charts
Open, high, low and close — plus the candle shapes that hint at what buyers and sellers are doing.

- 1
The four prices in every candle
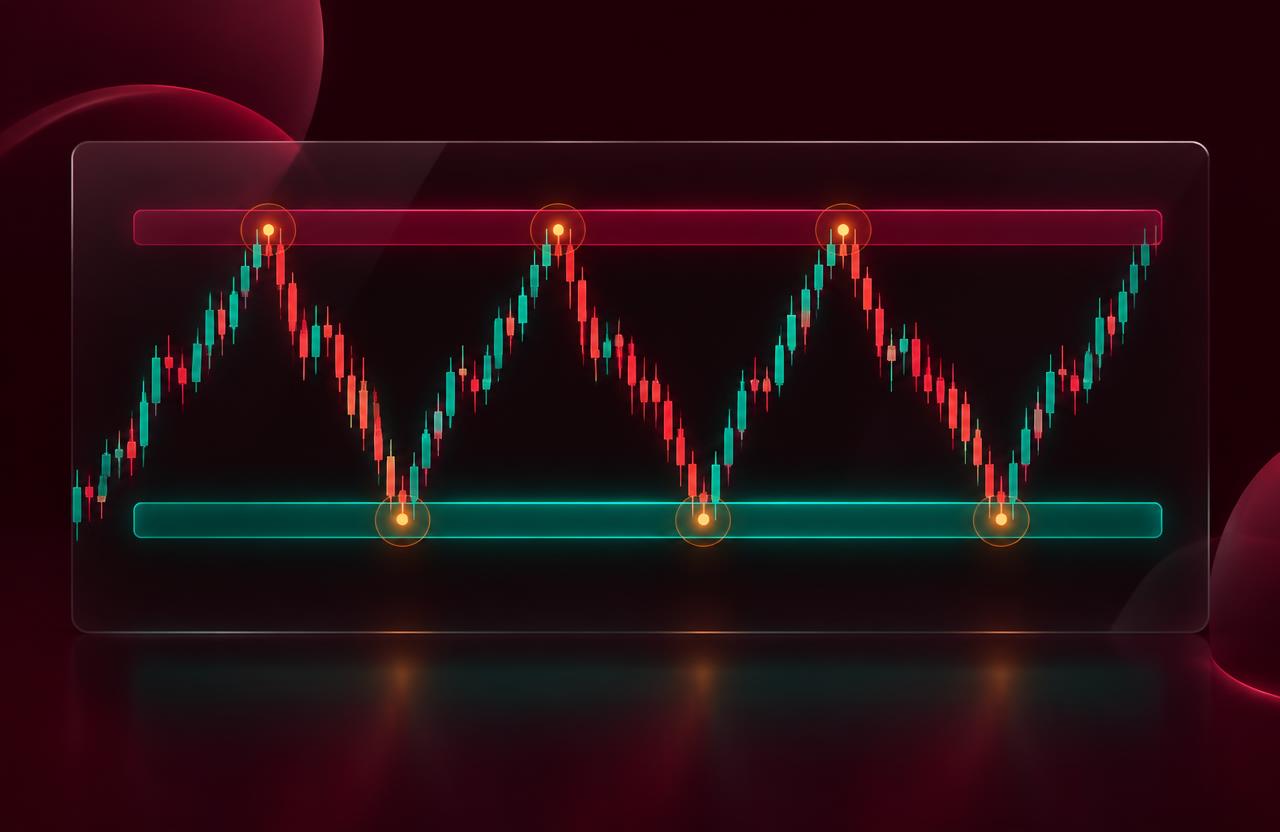
Each candle records the open, high, low and close for its time period. The thick body runs from open to close; the thin wicks reach to the high and low. A green body closed higher than it opened, a burgundy body closed lower.
- Big bodies = strong conviction.
- Tiny bodies = indecision.
 2
Wicks show rejection
A long lower wick means sellers pushed price down but buyers pushed it back up before the candle closed. A long upper wick shows the opposite. These rejections often appear near important levels.
- A long lower wick at support can hint at buyers stepping in.
- One candle is a clue, not a signal on its own.
- 3
Common single-candle shapes
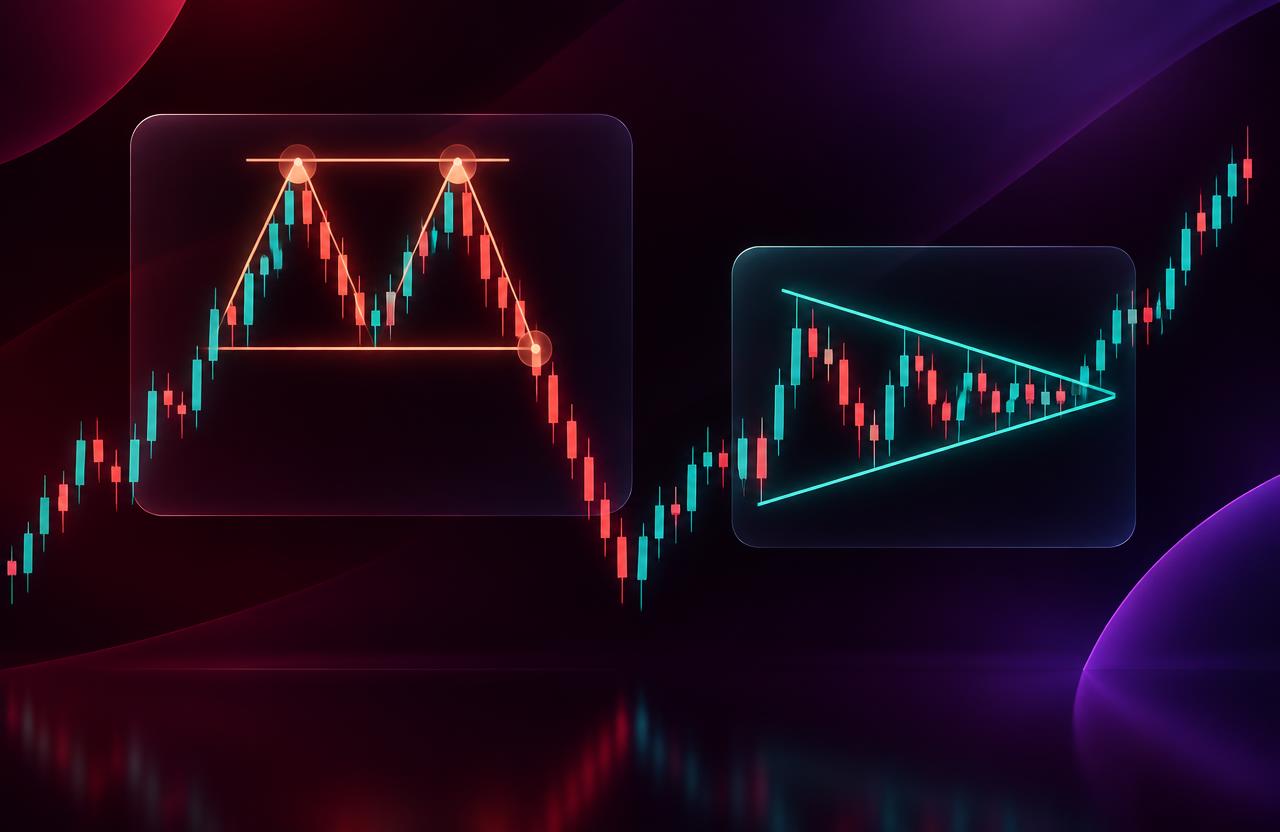
A doji has almost no body — buyers and sellers ended level. A hammer has a small body and long lower wick after a fall. A shooting star has a small body and long upper wick after a rise. Each suggests the current move may be tiring.
- Wait for the next candle to confirm.
- Shapes matter more at key levels than in the middle of nowhere.
 4
Engulfing candles
A bullish engulfing pattern is a green candle whose body completely covers the previous burgundy body — buyers took control. A bearish engulfing is the reverse. They are among the most-watched two-candle patterns.
- Engulfing candles after a long move are more meaningful.
- Practise spotting them on the 15m and 1h charts in the Lab.
Key takeaways
- Body = open to close; wicks = high and low.
- Long wicks show rejected prices.
- Patterns need context and confirmation.