Lesson 5 of 17 · Reading charts
Support and resistance
Find the price zones where markets tend to stop, bounce or break — and use them to plan trades.
- 1
What support and resistance are
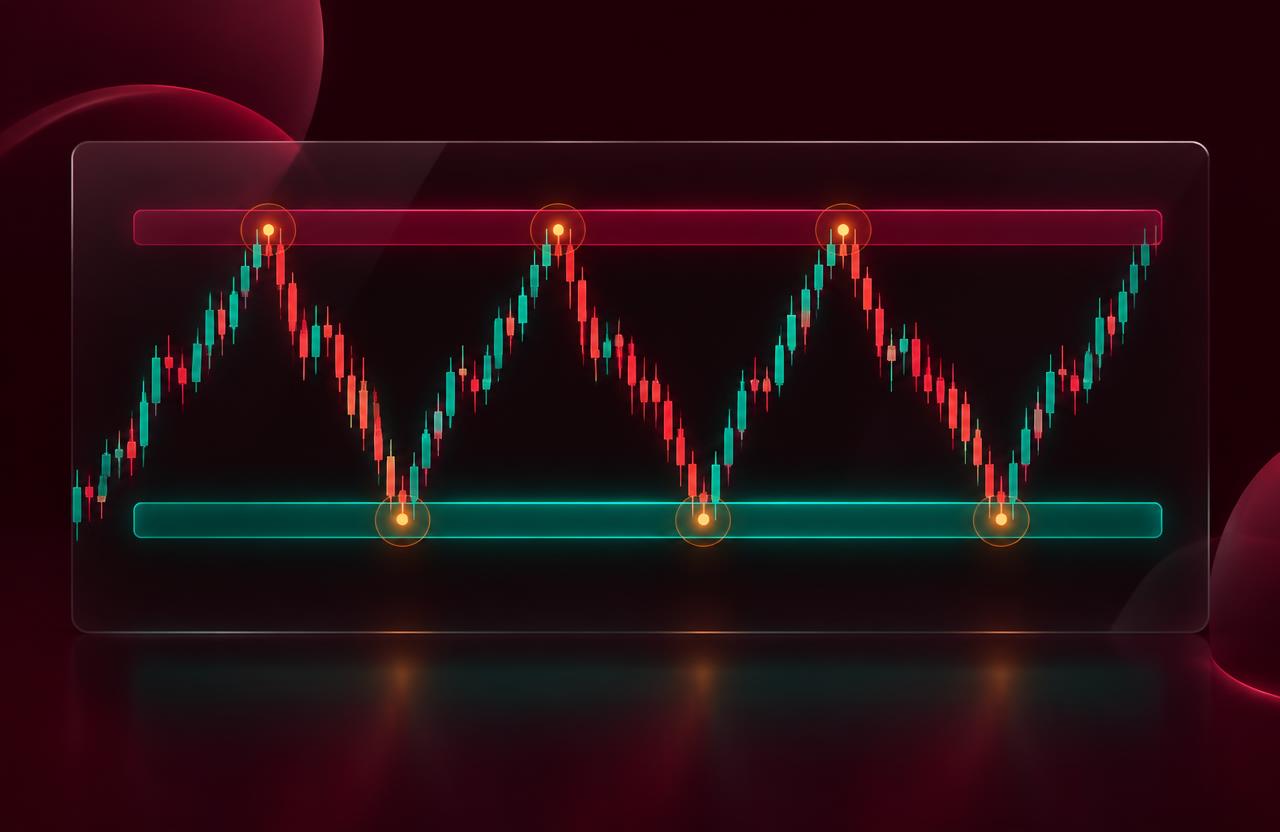
Support is a price zone where falling prices have repeatedly stopped and bounced. Resistance is a zone where rising prices have repeatedly stalled. They form because traders remember those prices and act on them again.
- Think of them as zones, not exact lines.
- The more times a level is tested, the more traders notice it.
- 2
How to draw them
Zoom out to the 1h chart and look for at least two or three swing lows at a similar price (support) or swing highs (resistance). Mark the zone that covers the wicks and bodies of those turning points.
- Round numbers like 1.1000 or 70,000 often act as levels.
- Fewer, clearer levels beat a chart full of lines.
 3
Bounce or break?
At a level, price either bounces or breaks through. A bounce trade buys near support with a stop just below it. A breakout trade buys after price closes above resistance, with a stop back below the broken level.
- Wait for a candle to close beyond the level before calling a break.
- False breakouts are common — keep stops in place.
- 4
Role reversal
Once resistance breaks, it often becomes support when price comes back to test it — and broken support often becomes resistance. This 'flip' is one of the most reliable ideas in chart reading.
- Retests give a second chance to enter.
- If a flipped level fails, the breakout may have been false.
Key takeaways
- Levels are zones traders remember.
- Plan stops just beyond the level you trade.
- Broken levels often flip roles.