Lesson 7 of 17 · Reading charts
Classic chart patterns
Double tops and bottoms, triangles, flags and head and shoulders — what they look like and how traders use them.

- 1
Double top and double bottom
A double top forms when price hits the same high twice and fails, then breaks below the low between the peaks. It can signal the end of an uptrend. A double bottom is the mirror image and can signal the end of a downtrend.
- The pattern is only complete when the middle level breaks.
- Measure the pattern's height for a rough target.
- 2
Triangles
Triangles form as highs and lows squeeze together. Symmetrical triangles can break either way; ascending triangles (flat top, rising lows) often break up; descending triangles (flat bottom, falling highs) often break down.
- Volume and momentum often fade inside the triangle.
- Trade the breakout, not the guess.
 3
Flags and pennants
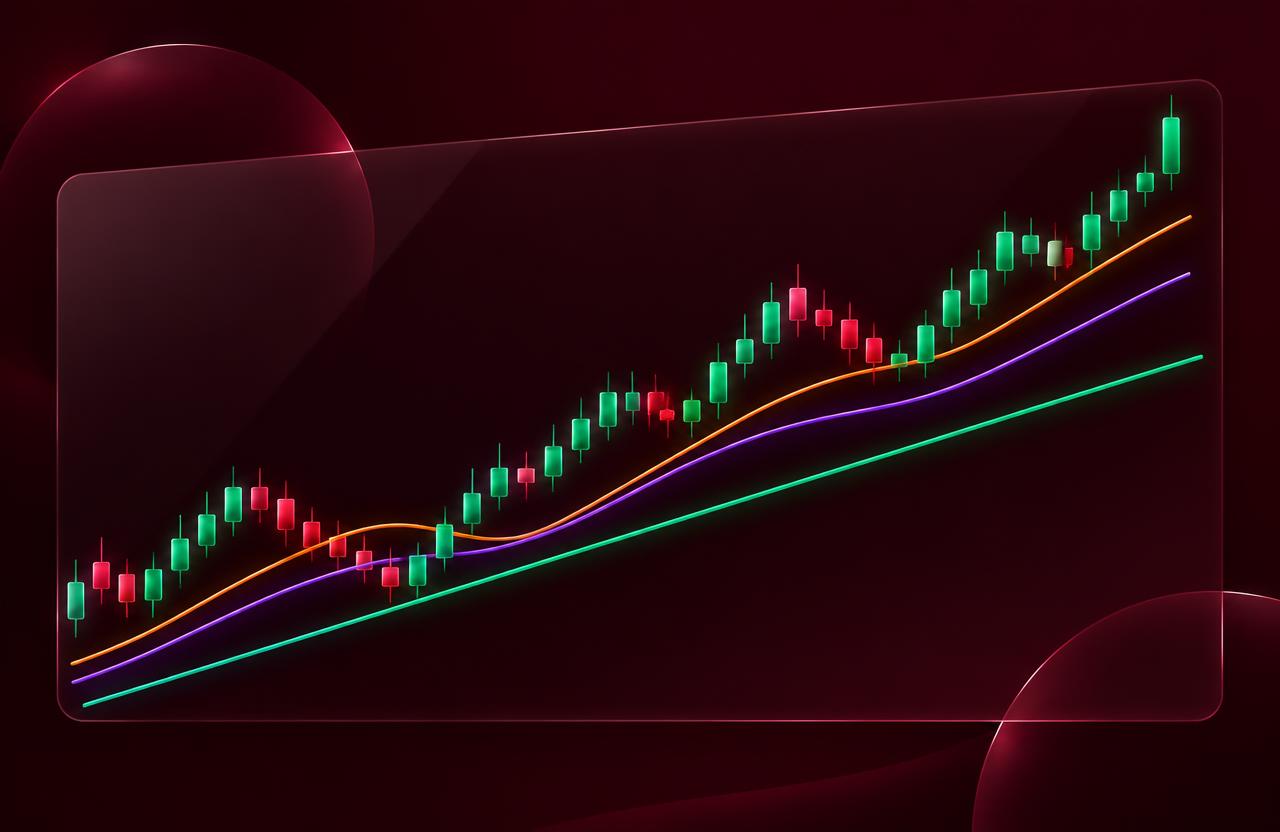
After a sharp move, price often pauses in a small sloping channel (flag) or tiny triangle (pennant) before continuing. These continuation patterns let traders join a strong move after a rest.
- The sharper the first move, the cleaner the flag.
- Put the stop beyond the other side of the flag.
 4
Head and shoulders
Three peaks with the middle one highest form a head and shoulders. When price breaks the 'neckline' connecting the lows between peaks, the uptrend may be reversing. An inverse head and shoulders can mark a bottom.
- Wait for the neckline break.
- Not every three peaks are a real pattern — be strict.
Key takeaways
- Patterns describe crowd behaviour, not certainties.
- Wait for confirmation — the break.
- Always know where you're wrong before you enter.