Lesson 3 of 17 · Getting started
Using the TRADE'S LAB terminal
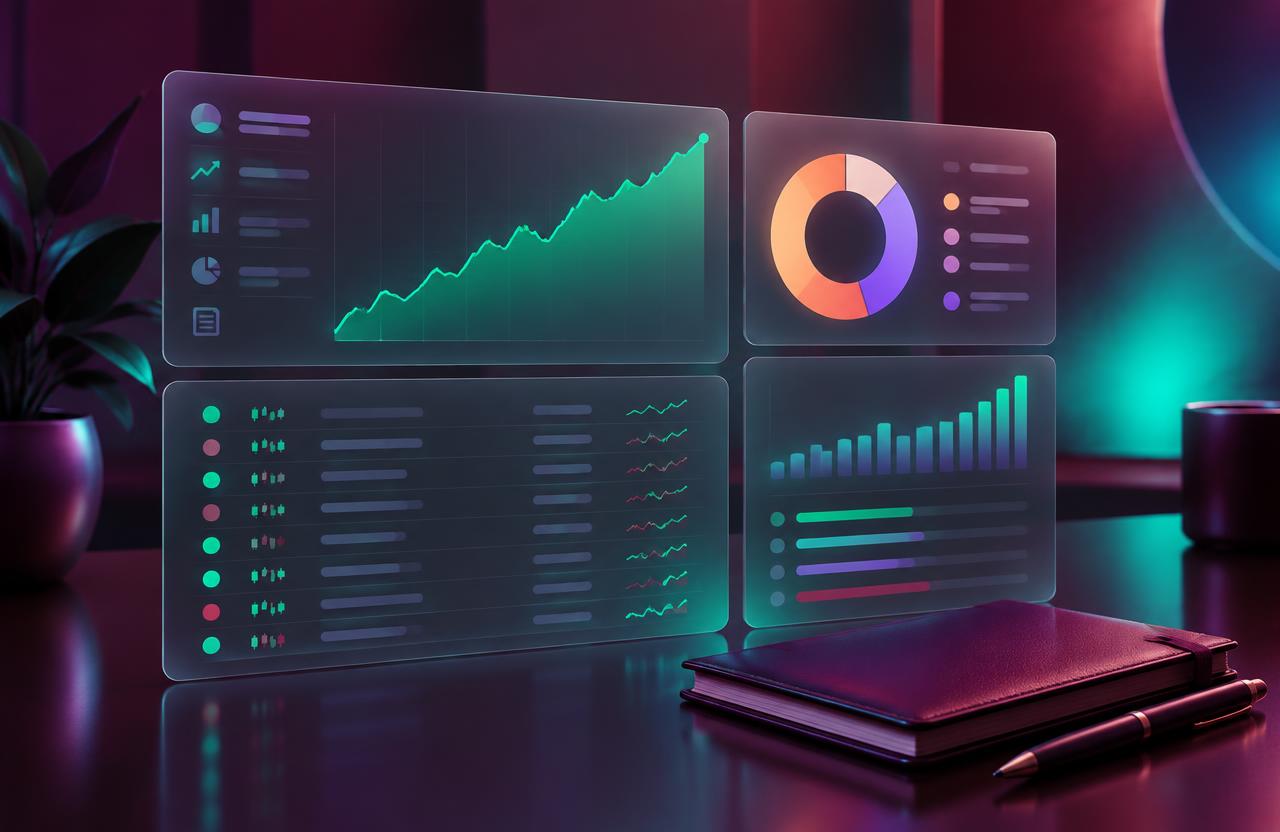
A tour of every panel on the Trade page: market list, chart, order ticket, account bar and positions.
 1
The account bar
At the top of the terminal you'll see your balance, equity (balance plus open profit or loss), margin used and your overall results. Equity is the number that tells you how you're really doing right now.
- If equity drops well below balance, your open trades are losing.
- Use Reset account to start again with $10,000 at any time.
 2
The market list
The left panel lists every market with its live price and daily change. Flashing green or burgundy means the price just ticked up or down. Tap any row to load that market.
- Daily change helps spot which markets are moving most.
- Crypto prices stream live; forex moves with simulated ticks around reference rates.
 3
The chart
The chart shows candles for the selected market. Change the time frame with the buttons above it. When you have an open position, your entry, stop loss and take profit lines are drawn so you can see them against price.
- Hover the chart to read exact prices.
- Watch how candles form in real time on the 1m view.
- 4
The order ticket and positions
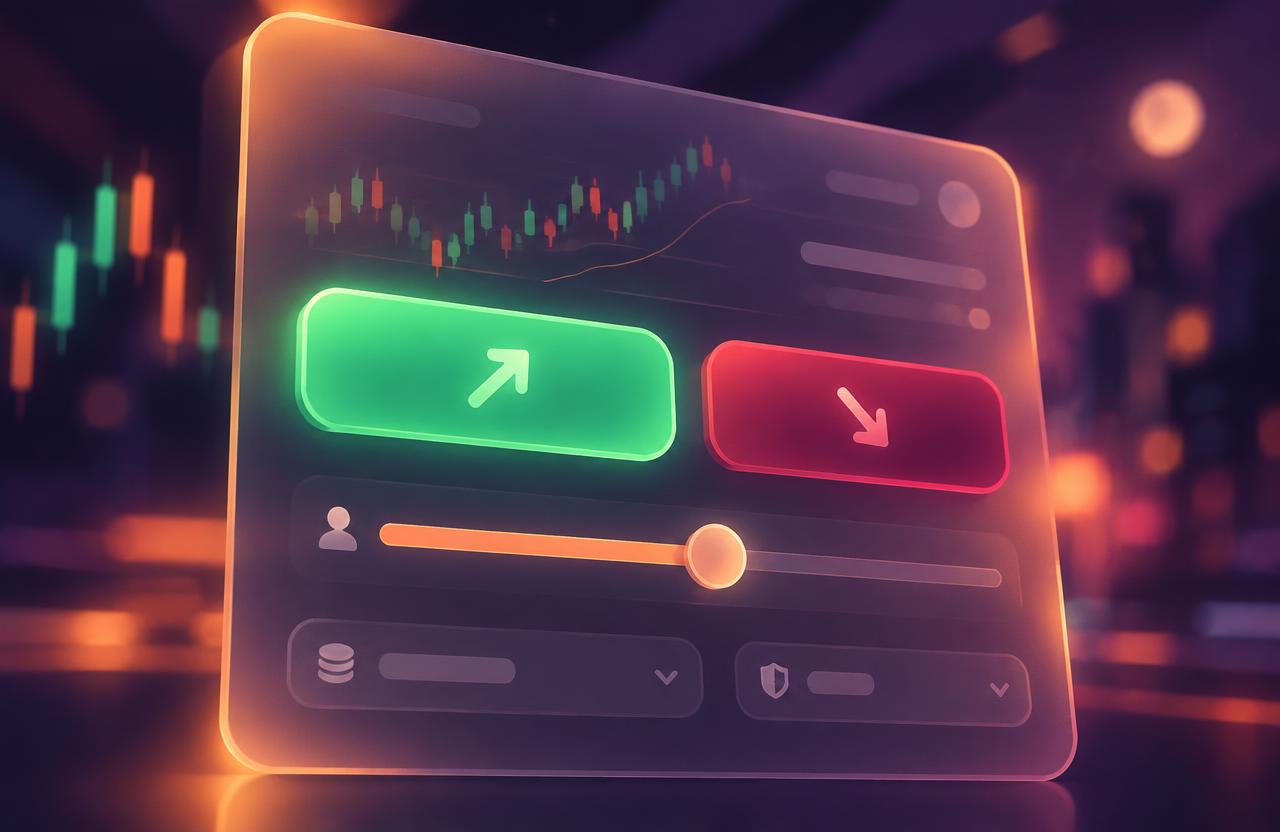
The order ticket on the right is where you choose Buy or Sell, size, leverage and optional exits. Below the terminal, the positions table shows open trades with live P&L, plus a History tab of everything you've closed.
- The ticket warns you if an order isn't valid.
- Click a position's market to jump back to its chart.
Key takeaways
- Equity shows your live result; balance shows settled cash.
- The ticket checks your order before it opens.
- History is your built-in trading journal.